Turn Business Data Into a Clearer Picture.
Bring operational information together into reports, dashboards and analytics views designed around the way your organization works.
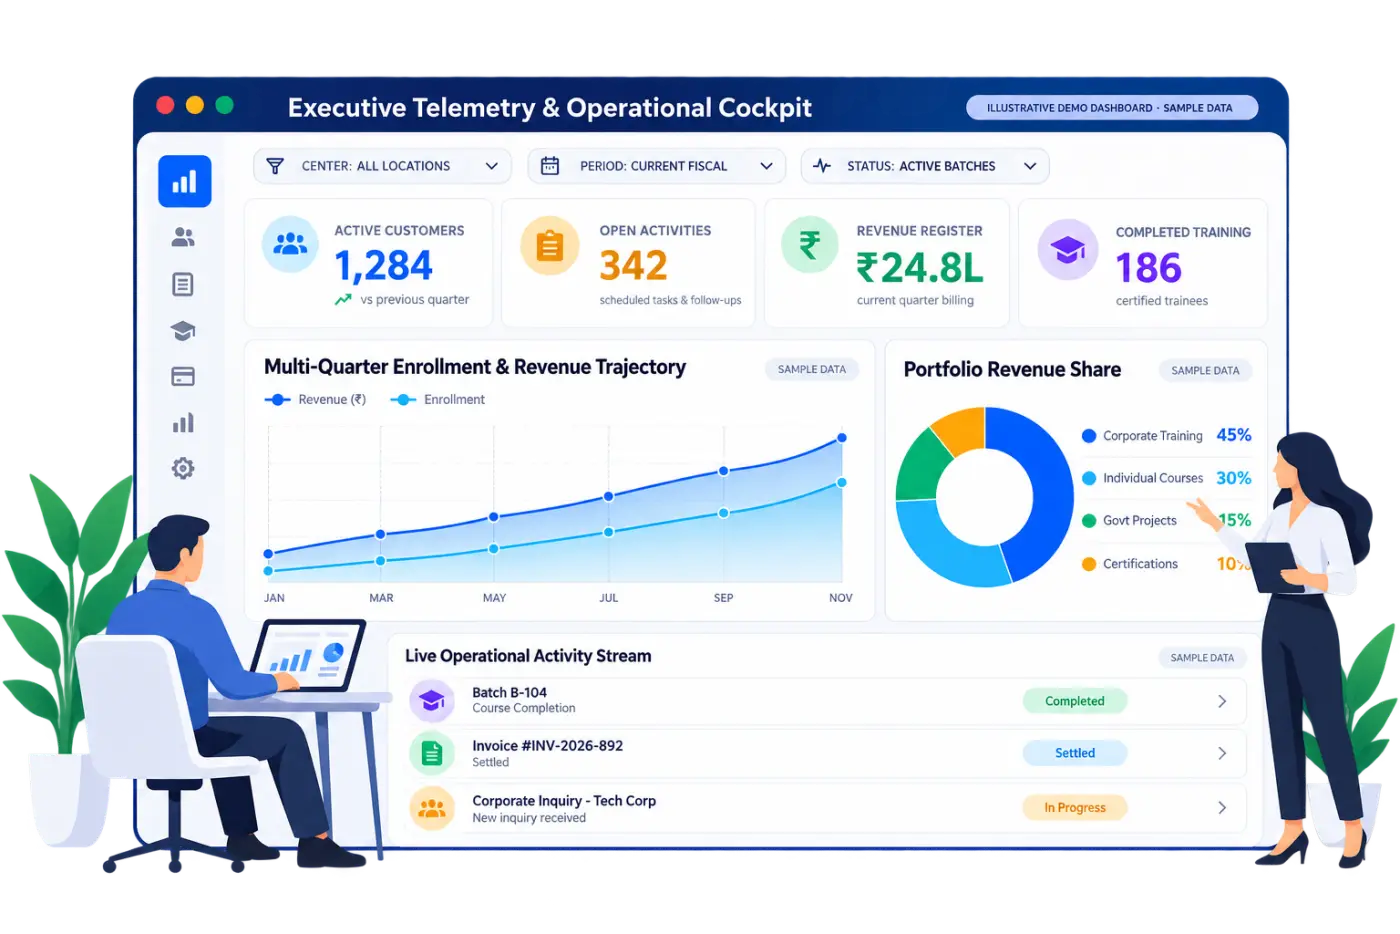
Configurable Column Matrices
Select and position operational columns to match exactly what your management needs to inspect.
Multi-Center Telemetry
Compare enrollment, revenue, attendance, and batch completion metrics across diverse centers.
Role-Based Access Scopes
Restrict report visibility by individual user, role tier, department, or institutional branch.
Audit-Ready Historical Registers
Export structured, verifiable logs and historical transactional registers whenever required.
Your Business Already Generates the Data.
Every student registration, training batch, sales inquiry, invoice settlement, workforce schedule, and WhatsApp notification creates verifiable facts. Rudram turns disconnected operational records into unified visibility.
CRM & Customer Pipeline
Training & Academic Engine
Accounting & Billing
People & HRMS
Communication & Channels
Workflows & Tasks
A Single Source of Truth Across Your Operating Model
Disconnected databases create blind spots. We unify transactional data from every operational node into structured reports and executive dashboards.
From Raw Information to Useful Information
A structured six-stage progression transforms raw transactional entries into executive clarity and decisive organizational action.
DATA
Capture raw operational entries across courses, batches, sales, and accounts.
FILTER
Isolate specific date ranges, centers, course categories, or account statuses.
GROUP
Organize records logically by center, trainer, customer segment, or ledger group.
COMPARE
Benchmark batch performance, center productivity, and budget allocations.
VISUALIZE
Render structured grids, KPI trend cards, and comparative visual matrices.
UNDERSTAND
Deliver actionable insights to department leaders and institutional directors.
Tailored Dashboards for Every Operational Role
Different stakeholders need different lenses on shared operational databases. Explore conceptual dashboard layouts configured for specific roles.
Conceptual dashboard designs · Illustrative sample UIExecutive View
Role: Founders & DirectorsComprehensive institutional overview covering aggregate revenue, total enrollment, multi-center output, and top operational alerts.
Sales View
Role: Sales & AdmissionsLead conversion stages, upcoming inquiries, corporate quote statuses, and representative follow-up schedules.
Finance View
Role: Finance & AccountingAging receivables, settled invoices, recurring institutional billing schedules, and general ledger reconciliation registers.
Operations View
Role: Operations ManagersApproval queues, pending certificate verifications, scheduled exam sittings, and multi-center task completion rosters.
Training View
Role: Academic DirectorsActive course batches, instructor allocation rosters, daily student attendance logs, and certification processing queues.
Multi-Center View
Role: Regional DirectorsComparative analysis across regional campuses, center revenue contributions, capacity utilization, and resource distribution.
Layered Visual Intelligence
Data flows seamlessly from top-level corporate indicators down to granular operational task execution.
Strategic KPIs & Institutional Trajectory
- Consolidated Financials
- Multi-Branch Growth
- Institutional Headcount
Sales, Training & Finance Registers
- Course Enrollment Run Rates
- Invoice Aging Logs
- Trainer Allocation
Daily Records & Task Automation
- Daily Attendance Check-ins
- Exam Sittings
- Certificate Approvals
Reports That Answer Real Business Questions
Reporting should not simply output rows of raw data. It should answer the specific questions that determine operational efficiency.
“Which training center is performing differently?”
Compares enrollment numbers, revenue per classroom, and student pass ratios side-by-side across all active branches.
“Which courses are generating the most sustained enrollment?”
Visualizes historical batch fill rates, trainee retention, and direct revenue per training module over customized quarters.
“Where are certificates taking longer to verify and issue?”
Tracks average turnaround time from exam completion through administrative verification to final certificate delivery.
“What is happening across our corporate client accounts?”
Displays open corporate training agreements, completed batches, outstanding balances, and recent interaction logs.
“What does the current financial picture look like?”
Aggregates invoiced sales, settled receipts, tax registers, and operational expenses in clear comparative charts.
Build, Filter and Customize Without Code
VheTM and Rudram business solutions allow authorized staff to define custom columns, apply deep filtering criteria, group records, and save favorite reports.
Custom Report Preview: Trainee Course Billing & Attendance
Showing 4 of 480 live records matched by filter criteria| Trainee Name | Batch Code | Center | Attendance | Fee Status |
|---|---|---|---|---|
| Aarav Sharma | B-104 | Ahmedabad | 96% | Settled |
| Priya Patel | B-104 | Ahmedabad | 92% | Settled |
| Rohan Mehta | B-108 | Vadodara | 88% | Partially Paid |
| Ananya Verma | B-112 | Surat | 98% | Settled |
See the Same Business From Different Angles
Slice and view operational databases on demand without altering underlying records.
ALL RECORDS
Complete institutional dataset across all branches & programs
CENTER = AHMEDABAD
Filtered to western regional campus operations
STATUS = ACTIVE
Excluding completed or archived historical records
PERIOD = FISCAL 2026
Isolated to current academic and financial year
SEGMENT = CORPORATE
High-value enterprise workforce training programs
Move From the Big Picture to the Detail
Navigate seamlessly from aggregate corporate indicators down to individual batch logs and learner records.
TOTAL INSTITUTION
Executive metrics covering overall revenue, enrollment, and operational capacity across all centers.
CENTER / BRANCH
Regional branch breakdown with center-specific financial accounts and physical facility utilization.
DEPARTMENT / PROGRAM
Departmental portfolios comparing vocational, technology, and corporate executive curriculums.
COURSE
Course-level syllabus delivery, fee structures, trainer allocations, and seasonal enrollment trends.
BATCH
Live classroom batch rosters, schedule milestones, attendance ratios, and exam dates.
TRAINEE PROFILE
Individual learner profile with fee receipt history, daily attendance percentage, and certificate status.
Reporting Across the Training Lifecycle
VheTM connects every operational milestone across learners, batches, examinations, and accounting to structured reporting registers.
VheTM consolidates training operations into structured reporting registers, eliminating manual re-keying and enabling real-time cross-center visibility.
- Real-Time Batch Attendance & Progress Sync
- Automated Multi-Sponsor Corporate Invoicing
- Verifiable QR Transcript & Certification Vault
- Multi-Center ACID Consolidated General Ledger
Training & Academic Performance Dashboard
Real-time visibility into student enrollment trends, batch schedules, exam performance, and certification issuance.
ILLUSTRATIVE DASHBOARD CONCEPT · SAMPLE METRICSActive Course Fill-Rate & Demand
Evaluation & Verification Telemetry
Understand Performance Across Your Organization
Compare operational output, batch capacity, and revenue generation across regional branches with standardized metrics.
Center Alpha (Main Campus)
Center Beta (Regional Branch)
Center Gamma (Corporate Facility)
Complete Financial Statement & Ledger Reporting
Integrated with Rudram Accounting and billing workflows for real-time transactional visibility without spreadsheet reconciliation.
SAMPLE FINANCIAL TELEMETRY · DEMO DATAProfit & Loss Summary
Track operational gross margins, instructor costs, and net institutional surplus.
Accounts Receivable Aging
Monitor open corporate training balances, tuition installments, and due dates.
General Ledger Balance Sheet
Audited asset accounts, liabilities, reserves, and multi-center journal reconciliation.
Expenditure & Purchase Register
Categorized operational costs for classroom facilities, courseware, and software licensing.
Share Safely Across Roles & Teams
Granular permission controls ensure stakeholders only view reports and registers appropriate to their operational scope.
Individual Staff / Trainer
Trainers and counselors access only their assigned course batches and student registers.
Department Specialists
Finance officers view payment entries while academic heads inspect curriculum progress.
Center & Branch Managers
Branch managers inspect complete operational registers for their designated physical center.
Institutional Executive Board
Curated executive dashboards accessible across executive leadership and board directors.
Curated Report Groups & Saved Favorites
Organize frequently referenced reports into logical domain folders and bookmark daily registers for one-click access.
Your Organization Doesn’t Operate Like a Template. Your Reports Shouldn’t Either.
Every organization measures success differently. We configure reporting schemas around your specific workflows, key performance metrics, and operational structures.
Configurable Fields
Include custom attributes like batch codes, project sponsors, or tax IDs.
Deep Logic Filters
Combine multiple conditional parameters without SQL queries.
Hierarchical Grouping
Group outputs by geographical region, center, trainer, or fiscal quarter.
Scheduled Exporting
Generate audit registers in structured formats when required.
Business Reporting + Operational Reporting
Connect financial results with day-to-day academic and operational execution in one unified reporting environment.
Commercial & Financial Telemetry
-
Sales Pipeline & Lead VelocityTracked
-
Customer Account Lifetime ValueTracked
-
Invoicing & Receivables AgingTracked
-
Fiscal Profitability StatementsTracked
Academic & Operational Telemetry
-
Trainee Attendance ComplianceTracked
-
Course Batch Progress TrackingTracked
-
Exam Sittings & Grade DistributionsTracked
-
Certificate Processing RegistersTracked
From Data to Decisive Action
How structured reporting transforms daily software interactions into measurable institutional progress.
Daily transactional interactions captured in ERP
Aggregated into structured relational tables
Visualized in clear visual KPI indicators
Contextual comparison across centers & cohorts
Targeted administrative and academic intervention
When Standard Reports Aren’t Enough
When organizations possess unique operational procedures or specialized reporting mandates, Rudram engineers bespoke data aggregation architectures.
Business Requirement
Define operational decision criteria
Data Schema Mapping
Structure relational tables & views
Report Architecture
Engineer aggregation algorithms
Visual Dashboard
Design intuitive telemetry screens
Operational Routine
Embed inside daily management workflow
Reporting Embedded Inside Custom Software
Every custom application or ERP platform developed by Rudram includes purpose-built reporting layers designed from the database up.
Communication History Connected to Operational Registers
Keep automated WhatsApp alerts, exam reminders, invoice notices, and fee receipts linked directly to customer and trainee profiles.
Batch schedule confirmed or invoice generated
WhatsApp/SMS alert sent with dynamic parameters
Timestamped delivery registered in customer profile
Communications reviewable within central registers
Pre-Built & Configurable Report Library
Explore the comprehensive library of reporting templates ready to deploy across training, education, CRM, and finance.
Batch Attendance Register
Daily check-in percentages and attendance compliance per batch.
Course Revenue Summary
Gross tuition receipts and revenue contribution by course category.
Certificate Verification Log
Audit log of issued certificates, verification dates, and learner IDs.
Center Performance Matrix
Comparative scorecard tracking multi-branch enrollment and output.
Admissions Funnel Report
Inquiry status stages, counselor assignments, and conversion ratios.
Exam Results Ledger
Class pass/fail rates, grade averages, and re-examination queues.
Aging Receivables Ledger
Outstanding invoices segmented by 30, 60, and 90+ day aging.
Trainer Allocation Schedule
Faculty workload rosters and batch teaching hour distributions.
Quarterly Fiscal Statement
Consolidated P&L summary and operational expenditure overview.
We Don’t Start With the Chart. We Start With the Business Question.
“Meaningful reporting begins by identifying the operational decisions leadership needs to make, then architecting the data capture to provide clarity.”
01 · UNDERSTAND
We study your actual operating model, decision workflows, and department reporting requirements.
02 · STRUCTURE
We design normalized data structures and aggregation logic to ensure accurate data capture.
03 · VISUALIZE
We render clean, role-appropriate dashboards and reports that empower teams to take decisive action.
Connected Reporting Across the Rudram Product Suite
Our specialized software products provide robust, built-in reporting capabilities designed for their specific operational domain.
VheTM
Dynamic batch, student, exam, certification & center reporting.
EduSec
Academic records, student rosters, timetables & fee registers.
Rudram CRM
Inquiry pipeline, lead conversion, and interaction histories.
Rudram Accounting
General ledger, P&L, balance sheets, and tax audit registers.
Rudram Invoice
Invoice aging, collection registers, and payment reconciliations.
Rudram Payroll & HRMS
Attendance compliance, leave balances, and payroll disbursements.
Reporting in Real-World Institutional Environments
See how established training academies and higher education institutions leverage Rudram reporting engines to eliminate blind spots.


Knowledge Grid Academy
Cross-Border Training ERP • Invoicing & Batches • Multi-Center Sync
Implemented centralized reporting across batch scheduling, student attendance registers, exam evaluations, and multi-center financial billing using VheTM.


Polyglot Institute
Cross-Border Operations • Multi-Institute Sync • Centralized SIS
Standardized reporting across corporate language programs, multi-instructor scheduling, corporate invoicing, and student certification workflows.


Brickfields Asia College
Higher Education Network • Multi-College Records • SIS Integration
Unified multi-college student registries, academic gradebooks, admissions pipelines, and regulatory compliance reporting using EduSec SIS.
Reporting & Analytics FAQs
Common questions regarding dynamic report builders, role-based access scopes, multi-center registers, and custom reporting architectures.
What types of reports can Rudram configure?
Rudram provides structured reporting across student registrations, course batches, daily attendance, examination evaluations, certificate issuance, sales inquiries, invoicing, and general ledger financial accounts.
Can reporting views be customized with specific columns and filters?
Yes. In platforms like VheTM, authorized administrators can choose custom column sets, apply multi-parameter filters (such as center, date range, or course category), group data logically, and save custom report configurations.
Can reporting combine information from different operational areas?
Yes. Because Rudram platforms operate on unified relational architectures, reports can cross-reference customer inquiry data with invoice payments, or student attendance with final certification statuses.
How does multi-center reporting work for multi-branch organizations?
Multi-center reporting allows leadership to inspect performance across all branches collectively or filter data by specific physical locations, comparing enrollment, revenue, and attendance side-by-side.
Can reports be restricted based on user roles and permissions?
Yes. Reporting access is governed by granular permission scopes (e.g., individual records only, user-level, role-based, or public executive dashboards) to protect sensitive institutional records.
Can reporting be built as part of a custom software development project?
Yes. When engineering bespoke software applications, Rudram designs relational database schemas with custom reporting interfaces, dashboards, and export tools tailored to your operational requirements.
Can reports be exported to spreadsheets or PDF formats?
Yes. Reports and registers can be exported to standard spreadsheet and document formats for external auditing, compliance documentation, or executive board review.
See Your Business More Clearly.
Tell us what information your organization needs to track, analyze, or report, and we will help you design a reporting environment around your actual operating model.